The data view component
Data views are the second main component of this tool. Like most things it is simple to create and use but also very powerful. Let me show you.
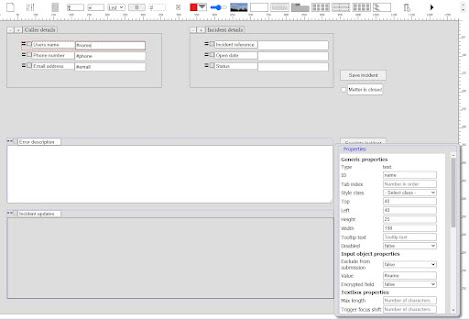
Just put the view on the form and select a view in the 'Source view' dropdown and you are set.
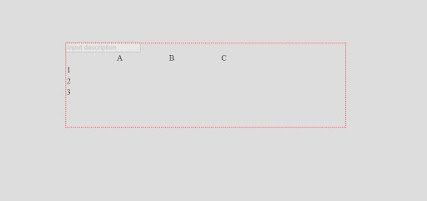
This is a view showing some would-be customers

This data source only have three records and all are shown since we have not filtered the view on anything. Sorting and filtering is done in the columns. Each column is a text box in which you can type something to filter results on. Ranges are possible. Sorting is done by clicking the arrows button
The X button is a function button for how the data should be presented in the graph mode. Yes, the data view can also be shown as a graph as shown on the image below.
The image above shows the same data view in which data has been grouped by name and the number of occurrances of each name is counted on the phone column. This is just one example of how the graphs work. There are several other types of graphs and data can be processed in several ways to produce more useful graphs. Graphs can be saved in the view object so it can be accessed by its shortcut in a popup-menu thet appears when clicking the top left button.
There is currently no way of printing a graph other than printing the whole page. This may be developed later on. It is however possible to print data views, and you are able to select which columns to print if you don't need them all. Just right-click in the view and select 'Print view' and a short preview with a column selector will be shown.
One way of accessing larger amounts of data for processing could be to use data views as a data source. To enable this there is a wrapper function that can be used from scripts. The wrapper can work with pre-defined views or views that are created on-the-fly in code. The wrapper can control everything around the view like download, sorting and filtering of data. You need to write a few lines of code to initialize this object.
One major problem when displaying data on a web page in anything other than an unformatted table is the amount of elements that needs to be rendered on the page. A list could be thousands or even millions of rows in length. It is not a good idea to display the whole list at once if longer than a thousand rows or so. The data view solves this by rendering only shorter chunks of data, 100-150 rows at a time. The data is loaded and displayed when the view scrolls past a certain point. This feature is made possible by a local caching function that keeps track of data that has already been downloaded and downloads more data only when needed. More of this cache component be read in the next entry.


Kommentarer
Skicka en kommentar